
The Elephant in the Returns
When CAGR Needs a Reality Check

We All Know a Monty
I have a friend, Monty — a confident crusader in life.
Every experience — eating out, travelling, or shopping — is out-of-the-world for him.
His default mode is mission mode: either all in or all out — no middle ground.
After a trip to a national park, for example, he knows (not just remembers) every detail— the best safari zone to spot a species, the dozen food stalls, the handloom shops nearby, the tricky trails, temple turns, and even a sacred mosque in a nearby village.
Meanwhile, you forget that you had started the conversation by sharing how relaxing your weekend was at a river cottage near that same park.
But now you’re listening to his story — about spotting a leopard and a tiger on his first safari.
Your safari? A few antelopes, maybe some apes... and elephant dung. That too after trying on two separate days, in two different safari zones.
You meek soul!
His stories swing between bliss and rare misery. Words like “relaxing” are boring to him.
I’m sure you know someone like Monty — in your office, your building, or from your college or school.
Meet the CAGR Cousins – Same Family, Different Games
There are two other characters I want you to meet:
Saint CAGR (St. CAGR) and Lieutenant CAGR (Lt. CAGR).
St. CAGR shows up immediately every time we invest. Like Monty, he can either make you feel like a genius – or completely lost.
You guessed it, St. CAGR and Lt. CAGR are quirky, made-up identities for distinguishing short-term and long-term compounded annual growth rates.
St. CAGR: When Returns Get Magnified
Imagine this — Monty knows that an asset is expected to grow at 12% per year over the long term.
But in the first 3 months, it drops by 10%. The app shows a scary CAGR of -40%.
That doesn’t look like the 12% he signed up for!
St. CAGR starts messing with his mind.
Another 3 months, it falls 15% more. Now it’s down 25% in 6 months.
The annualised return? A whopping -50%.
Monty starts doubting the asset. “This is my worst investment ever!”
Monty, being Monty, panics and sells.
Sounds far-fetched? It may be for some seasoned investors like you — but for many everyday investors, the fear is very real. The recent wave of SIP closures says it all. In the first three months of 2025 alone, SIP discontinuations have exceeded new registrations by a wide margin. This pushed the SIP discontinuation ratio past 100% — something we haven’t seen in the last five years.
And honestly, we haven’t even hit a real, prolonged slump yet. Want to know what that might look like? Check out “Want to Thrive in the Markets?”.
Monty Finds a Multi-bagger?
But Monty doesn't give up. He buys another asset — let’s call it Asset B, also expected to return 12% annually.
In the first 3 months, it goes up by 5%. The app now shows an annualised return of 20%.
Next 3 months, it’s up another 10%. CAGR now flashes 30%!
“See, told you! Multi-bagger!” he beams and doubles up.
But is Asset B actually better?
Not necessarily. Both Asset A and B are from the same asset class, with similar long-term potential.
The flashy short-term gains of Asset B come from just two things:
When Monty bought it
How long he held it
That’s all. It’s just a short-term magnification of returns — probably not a multi-bagger. St. CAGR gets exaggerated in volatile assets — anything other than bank FDs or liquid funds.
Even after multiple initial years, the returns can look wild.
E.g., the price of an asset expected to clock a CAGR of 12% over the next decade may:
Jump 25% a year for the first 5 years, and then go flat, or
Fall 25% a year for the first 3 years, then shoot up 33% annually for the next 7
St. CAGR lies, Monty Cries
Like Monty, if we let short-term returns guide our judgment of an asset’s quality — in either direction — we tend to:
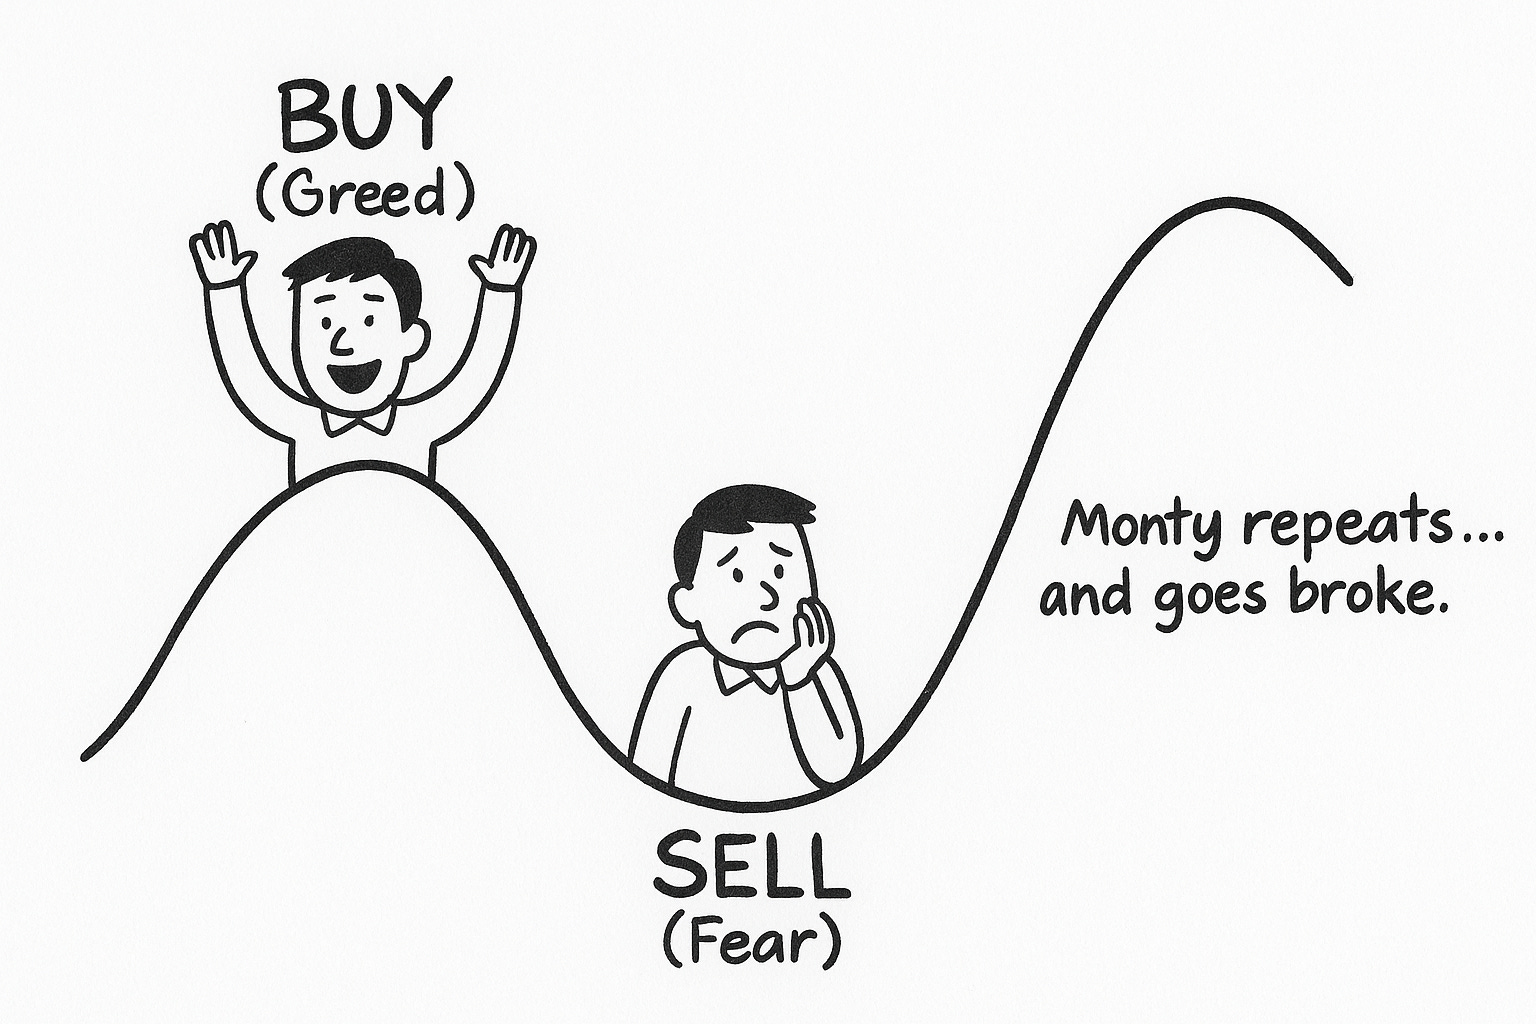
1. Buy what’s gone up, assuming it’s good; sell what’s gone down, assuming it’s bad – distorting value consciousness
2. Buy too much of what has gone up recently - distorting asset allocation
These are well-known behavioral traps, proven to be detrimental to your financial health.
The loss of value consciousness becomes especially visible in non-yielding assets such as crypto and gold – since they cannot be valued – and hence are difficult to classify as expensive or cheap at any price point.
The distortion of asset allocation shows up most clearly in big-ticket purchases such as real estate. “Another home for my child” is quite a trend these days, after the prices have shot up post-2020.
Say Hi to Lt. CAGR
Ignore the elephant — those big, noisy St. CAGR numbers.
Instead, let us build a solid, well-informed view of the long-term returns and risks for each asset.
The longer we stay, the clearer the play.
What’s long-term?
Think 5 to 7 years minimum. That’s when things start making real sense.
Why 5–7 years? We can dig into that in another post.
Found this post useful? Help another Monty out there!